Everything about your training, food and recovery lives on one tab, at a glance, without digging through separate screens.
Everything about your training, food and recovery, on one tab.
How to use it
Open the Progress tab.
Tap any tile to open its detail, chart and explainer.
Tips
A tile that has nothing to show yet still opens — it explains what it needs rather than sitting there blank.
While Strathlon can't see your workouts from other apps, or something is stopping them arriving, a card sits above the tiles to say so: see Workouts from other apps.
Tile explainers with Learn more
Every tile's detail screen has an ⓘ explaining what it is, how to read yours, where it comes from and why it matters.
WhereProgress›tile detail›ⓘ
What it is
Tap the ⓘ on a tile's detail screen for What it is, How to read yours (where the metric has one), Where it comes from and Why it matters, with a Learn more link where one exists.
Why it helps
You can understand any figure on Progress without leaving the tile, in the app's own words for that exact metric.
How to use it
Open any tile's detail screen from the Progress tab.
Tap the ⓘ.
Read the blocks that apply, and tap Learn more if it's shown.
Tips
A tile with nothing logged yet shows a How to get it going block instead, so an empty tile still tells you what to do next.
A free 0–100 score blending your sleep, resting heart rate and between-set recovery, with a full breakdown one tap in.
WhereProgress›Readiness›Your readiness
What it is
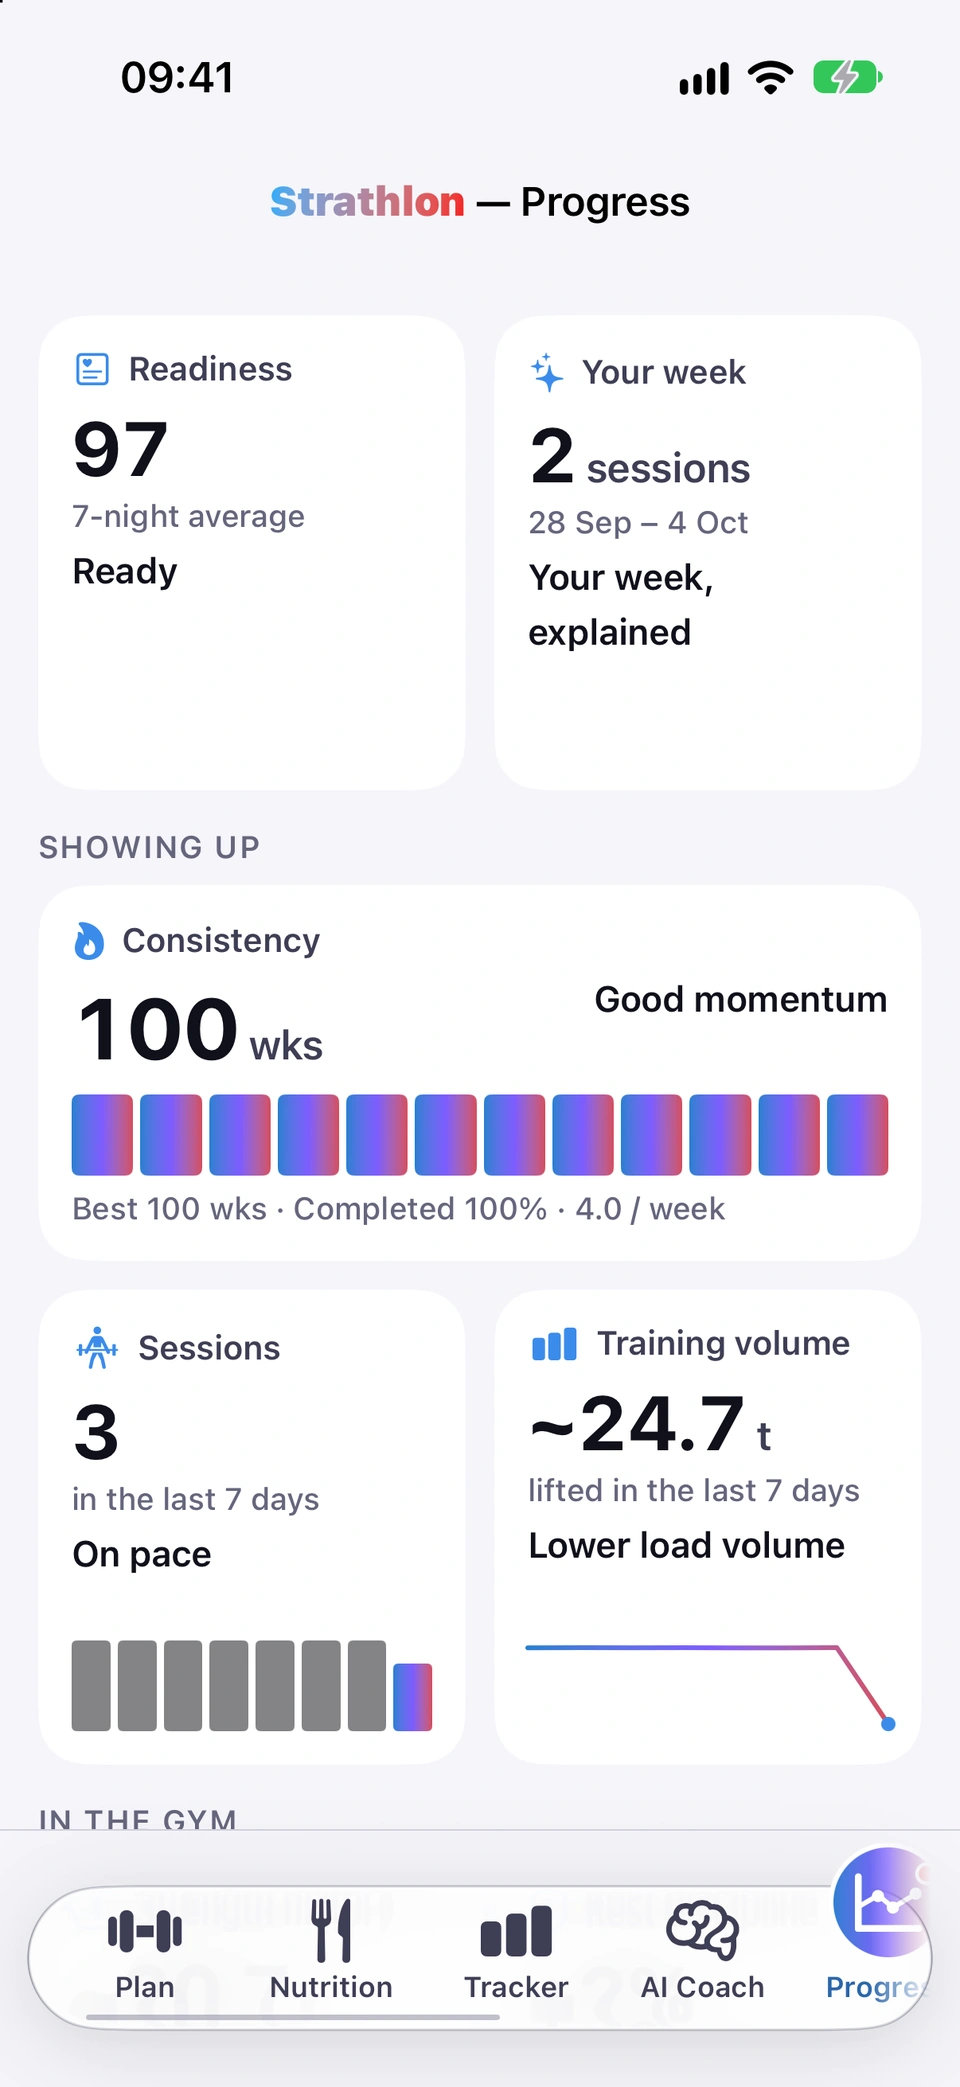
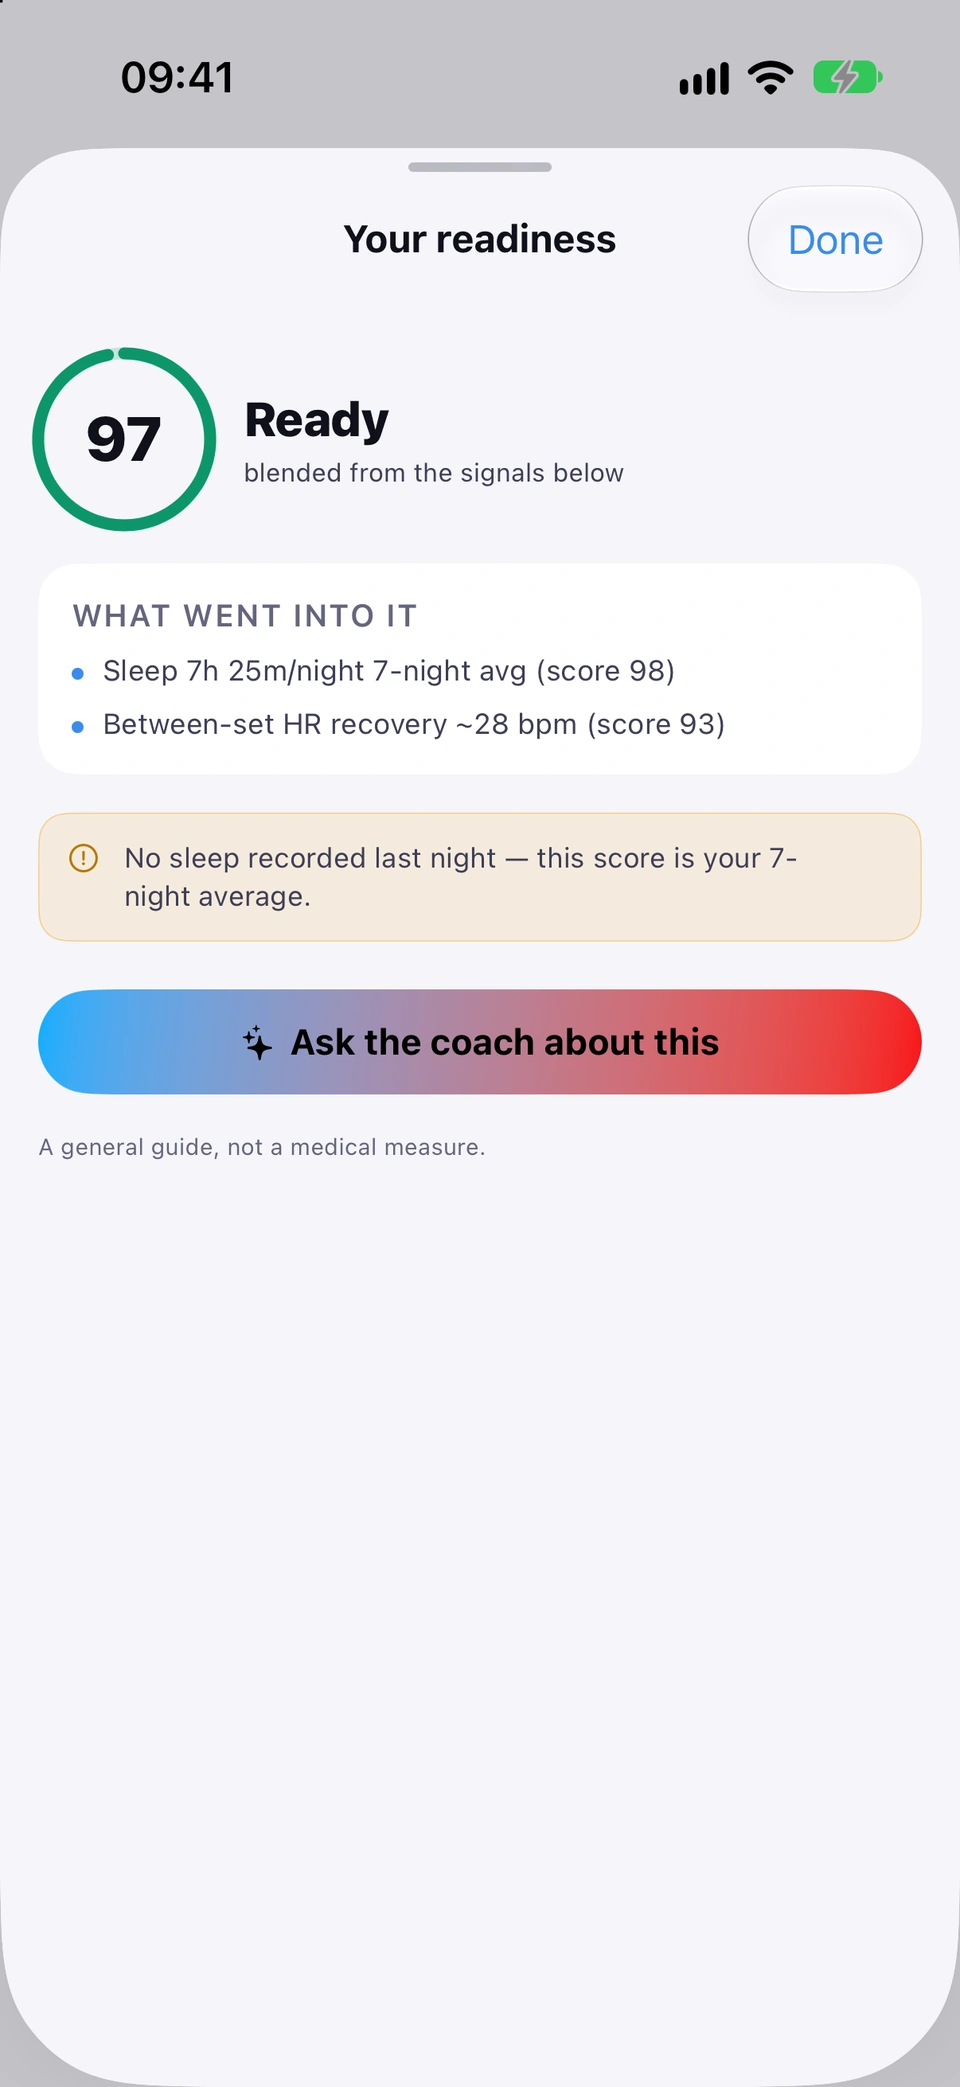
The Readiness tile shows a score and a band (for example Ready). Tap it for Your readiness, a ring, WHAT WENT INTO IT with a line per signal, any caveats that apply, and Ask the coach about this.
Why it helps
One free number tells you, at a glance, whether today is a good day to push hard or ease off, worked out from your own recent recovery signals rather than guesswork.
How to use it
Open the Progress tab. Readiness sits at the top left, beside Your week.
One score, and exactly what fed into it.Tap it for Your readiness, with the score ring, band and WHAT WENT INTO IT breakdown.
A caveat banner appears when relevant — for example when the score is built from only one signal, or a cycle phase is affecting it.
Good to know
Reads Not enough data yet until it has enough sleep or resting-heart-rate history. It's "a general guide, not a medical measure", as the sheet itself says.
If you logged a high body temperature in Apple Health recently, Your readiness adds a note that suggests resting. The score is unchanged.
A written review of this week or your last 30 days, with a compact stats row and Ask the coach about this.
With the subscription
WhereProgress›Your week
What it is
Tap the Your week tile, or Your week's ready on the AI Coach tab, for Your progress: a segment for This week or Last 30 days, a written narrative, a compact stats row (which also shows your Move ring, Stand hours, Mindful minutes, Flights climbed and Avg blood pressure when Apple Health holds them for the period), and Ask the coach about this.
Why it helps
It reads back your week or month in plain English, using your own numbers, rather than leaving you to piece it together from separate tiles.
How to use it
Open the Progress tab and tap Your week, or tap Your week's ready on the AI Coach tab.
Read the narrative, then switch to Last 30 days for the longer view.
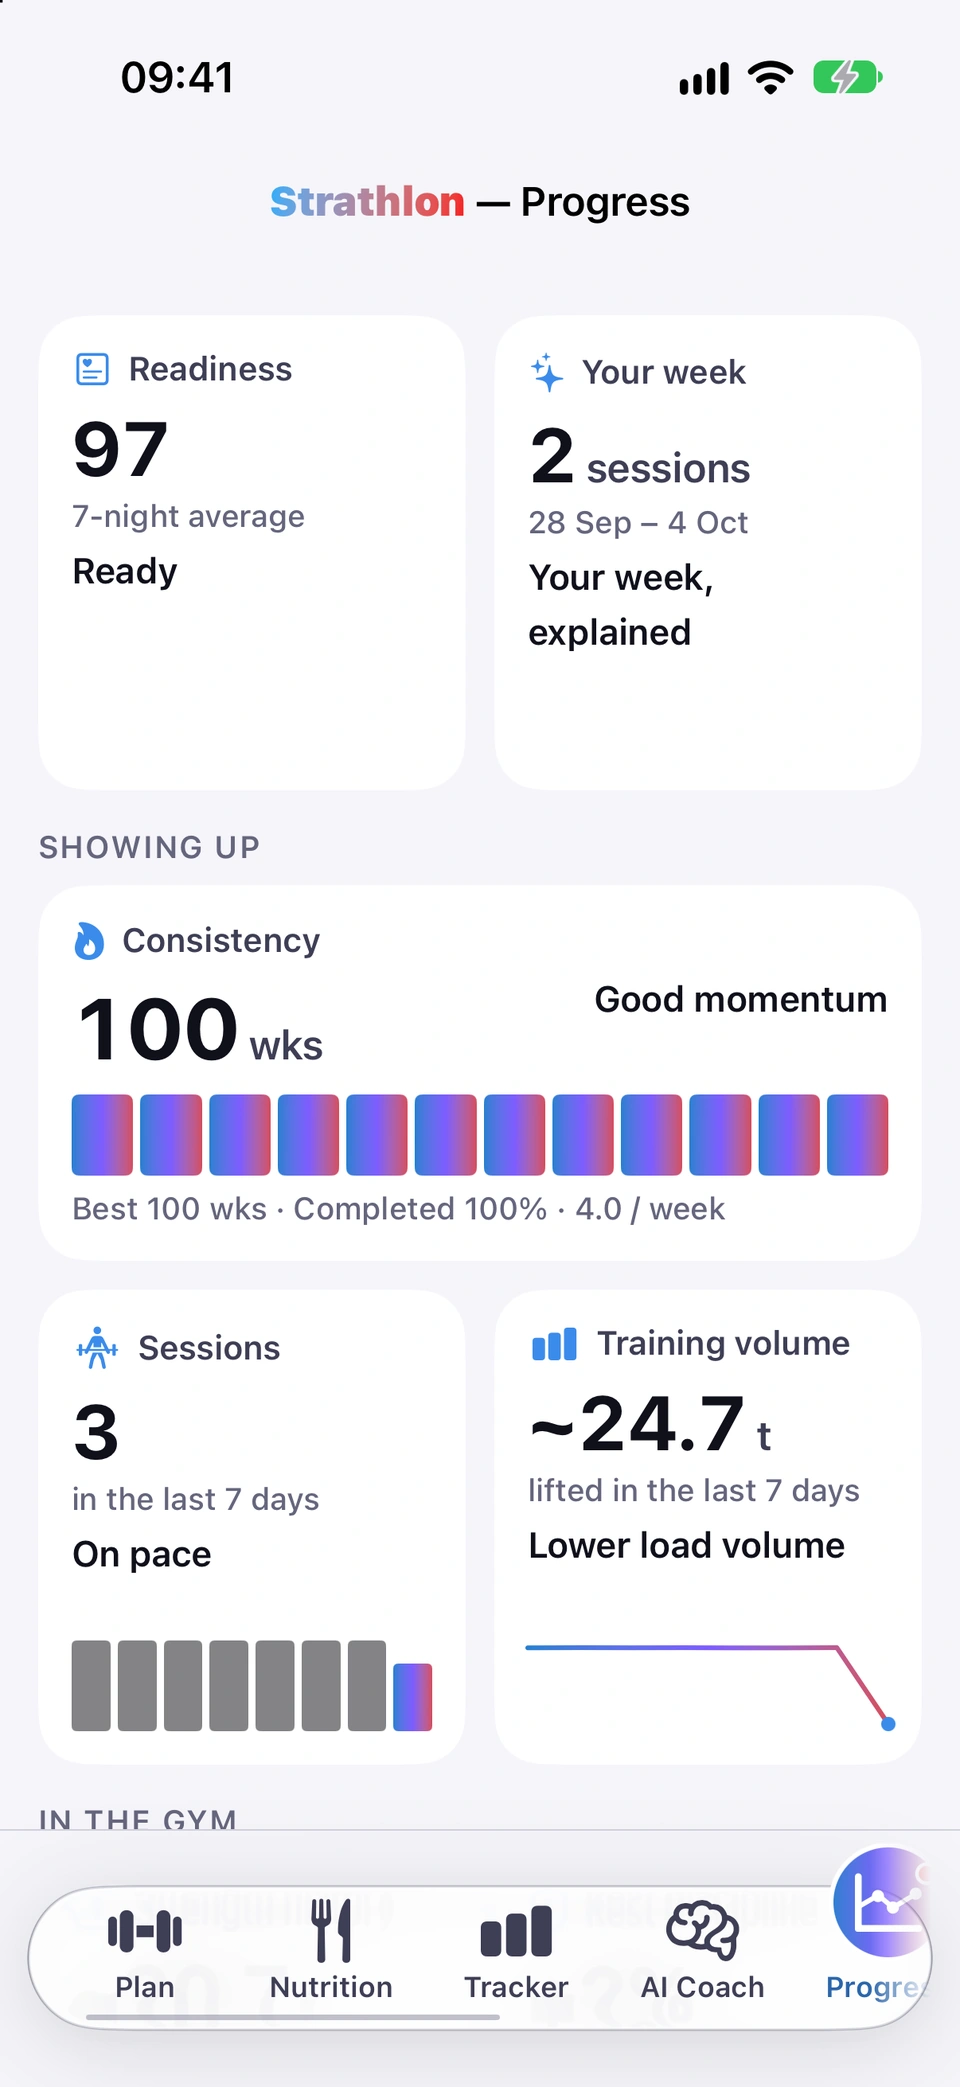
Three tiles under Showing up: how regularly you train, how many sessions, and how much weight you're lifting over time.
WhereProgress›Showing up
What it is
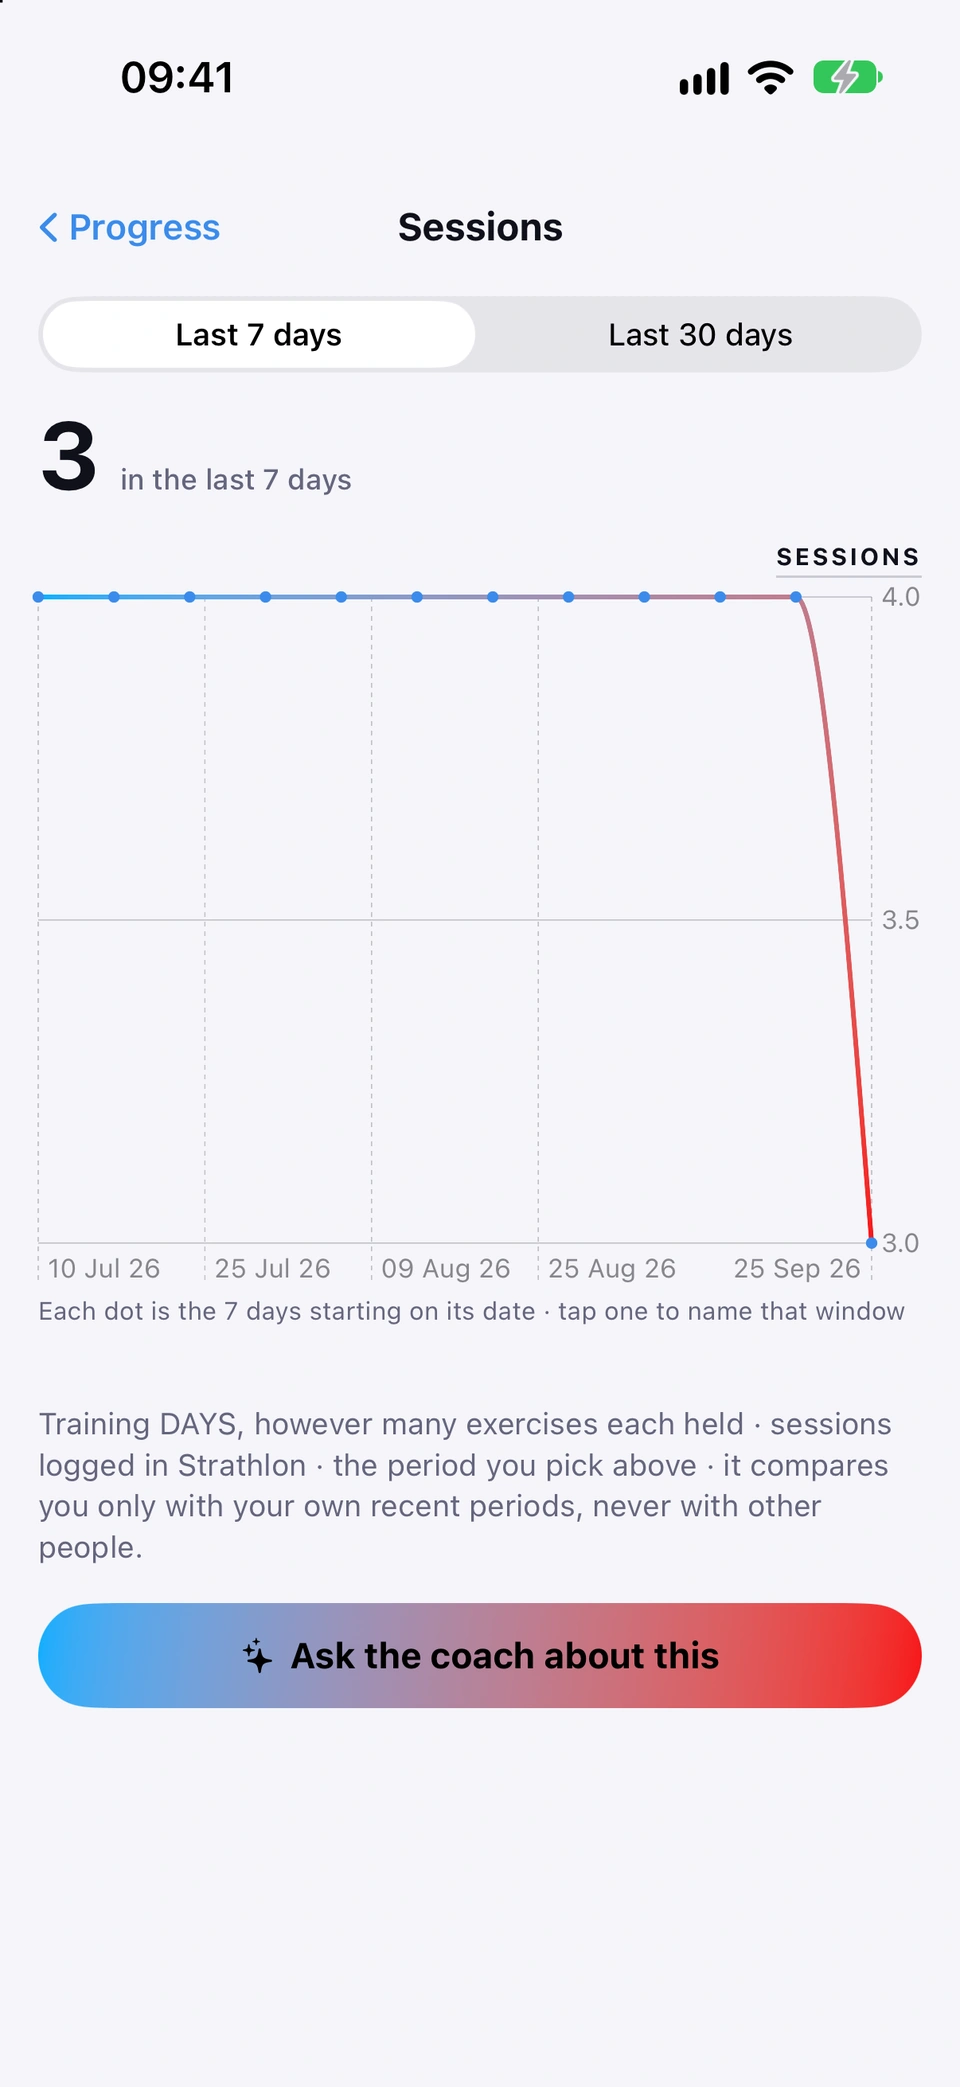
Consistency shows up to twelve weeks as blocks with your longest streak and completion rate. Sessions shows the last 7 days' session count against your own average, which counts the weeks you didn't train too. Training volume shows the weight lifted over the last 7 days.
Why it helps
Showing up is the strongest predictor of progress, so this section puts it first, with sessions and tonnage right beside it.
Showing up, in three figures.
How to use it
Open the Progress tab and find Showing up.
Tap Consistency, Sessions or Training volume for its full chart.
A week with nothing logged shows as empty on the Sessions tile and its full chart, never as a repeat of an earlier week's count.
If you haven't trained for a while, the Sessions tile says how long, for example No sessions in the last 9 weeks (or in months, for a longer gap). No training weeks yet is kept for someone who has never trained.
Good to know
Training volume only counts sets logged with a weight — sets logged without one don't add to the total, and the tile says so.
Weight lifted over the last 12 weeks, called Improving, Holding or Declining, with which movements are climbing.
WhereProgress›In the gym›Strength history
What it is
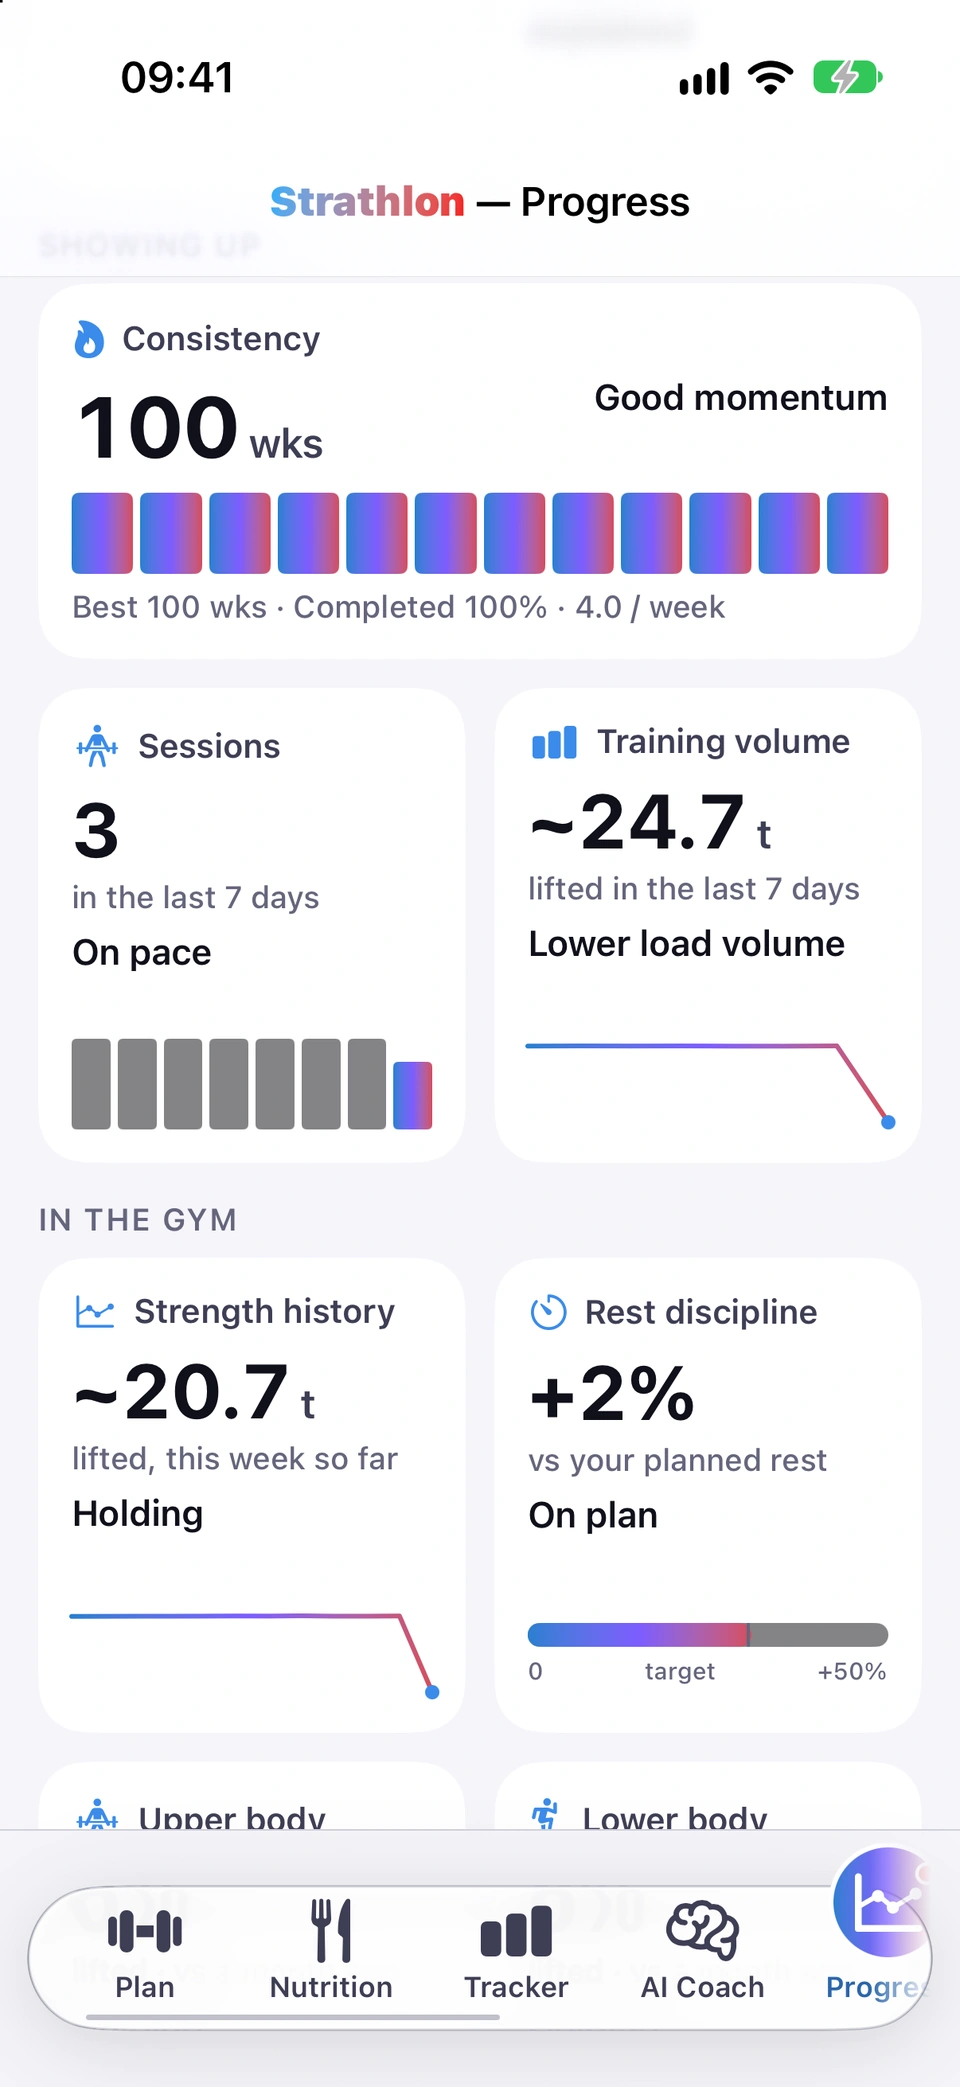
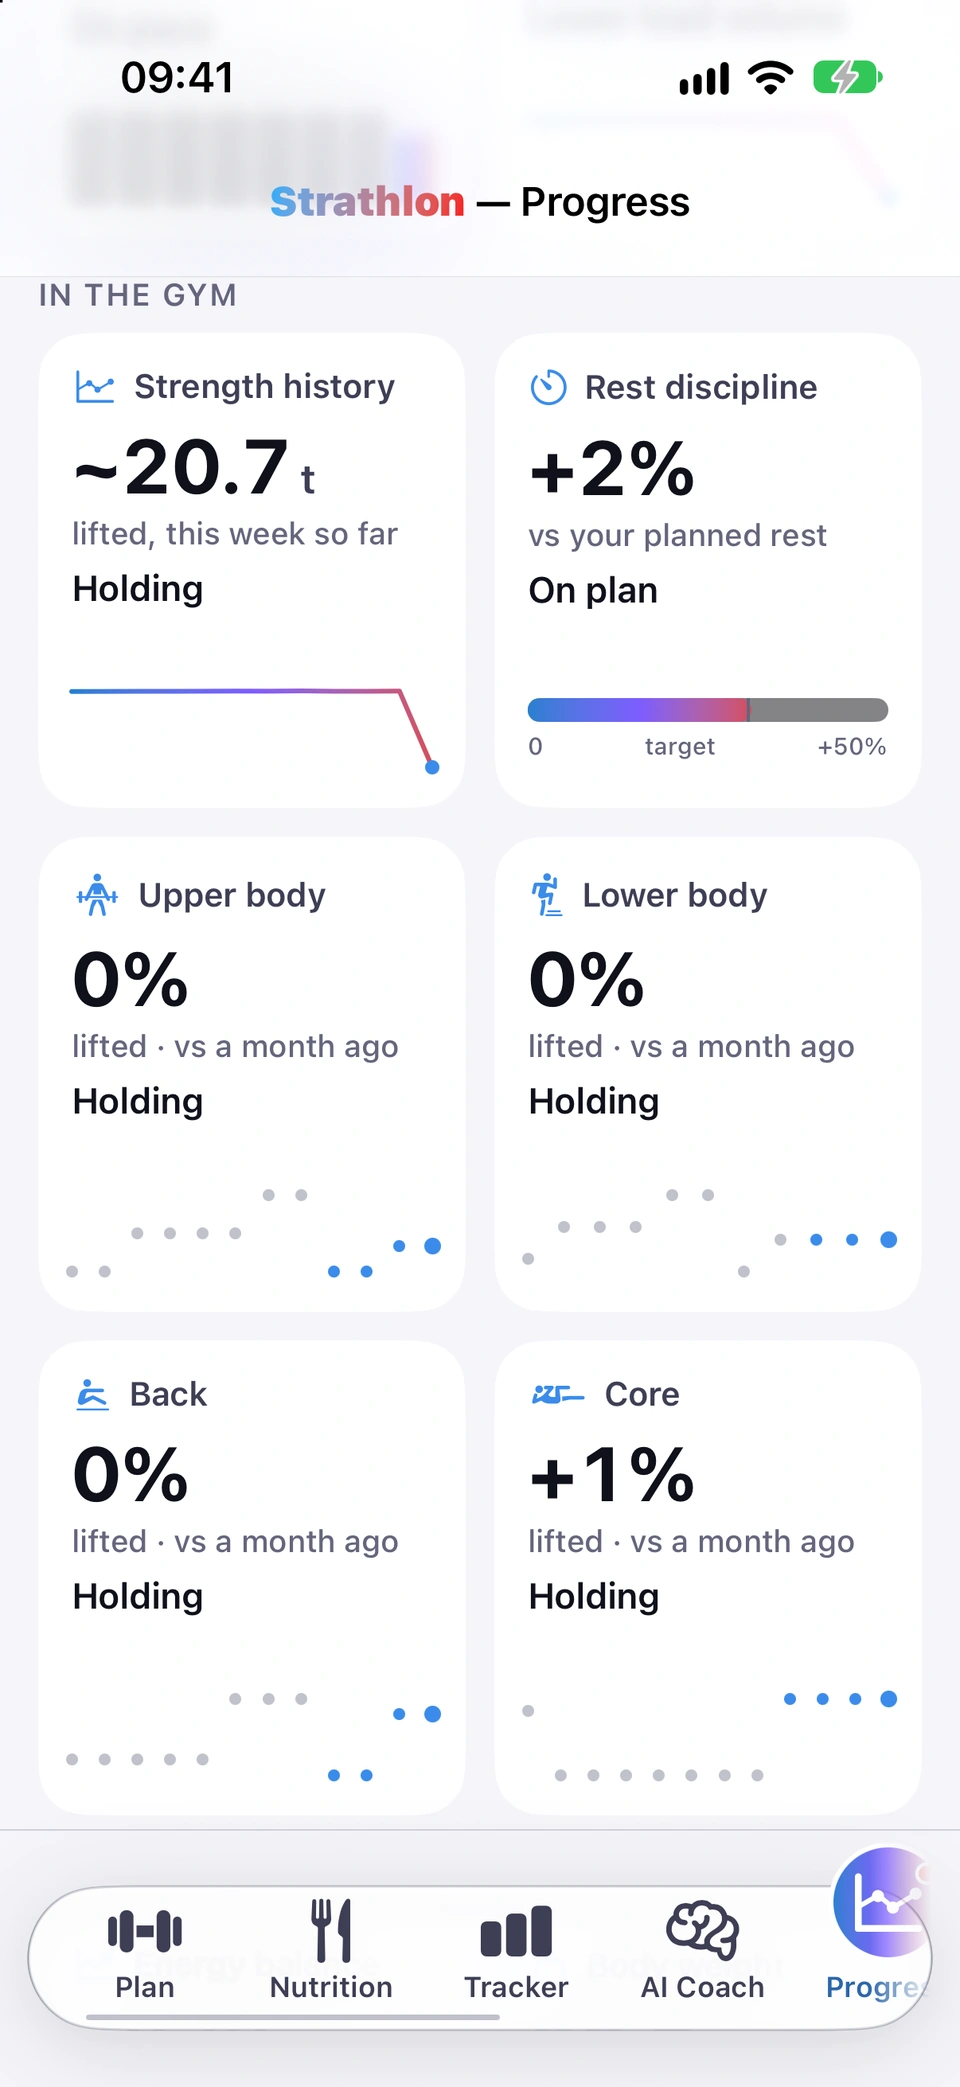
The Strength history tile shows weight lifted for the latest logged week and a call — Improving, Holding or Declining — with how many of your movements are climbing. Tap it to open your four muscle groups.
Why it helps
One tile tells you, in one word, whether your lifting is trending up, holding steady or slipping, across everything you train.
One word for how your lifting is trending.
How to use it
Open the Progress tab and find Strength history under In the gym.
Read the call and the weight lifted for the latest week.
A movement the app couldn't match to a muscle group still counts toward this tile's total — a footnote says how many, and which group screen to check for the rest.
Good to know
Reads No lifts logged until you've logged weighted sets. Before enough sessions have repeated, it reads Building your trend rather than guessing a direction.
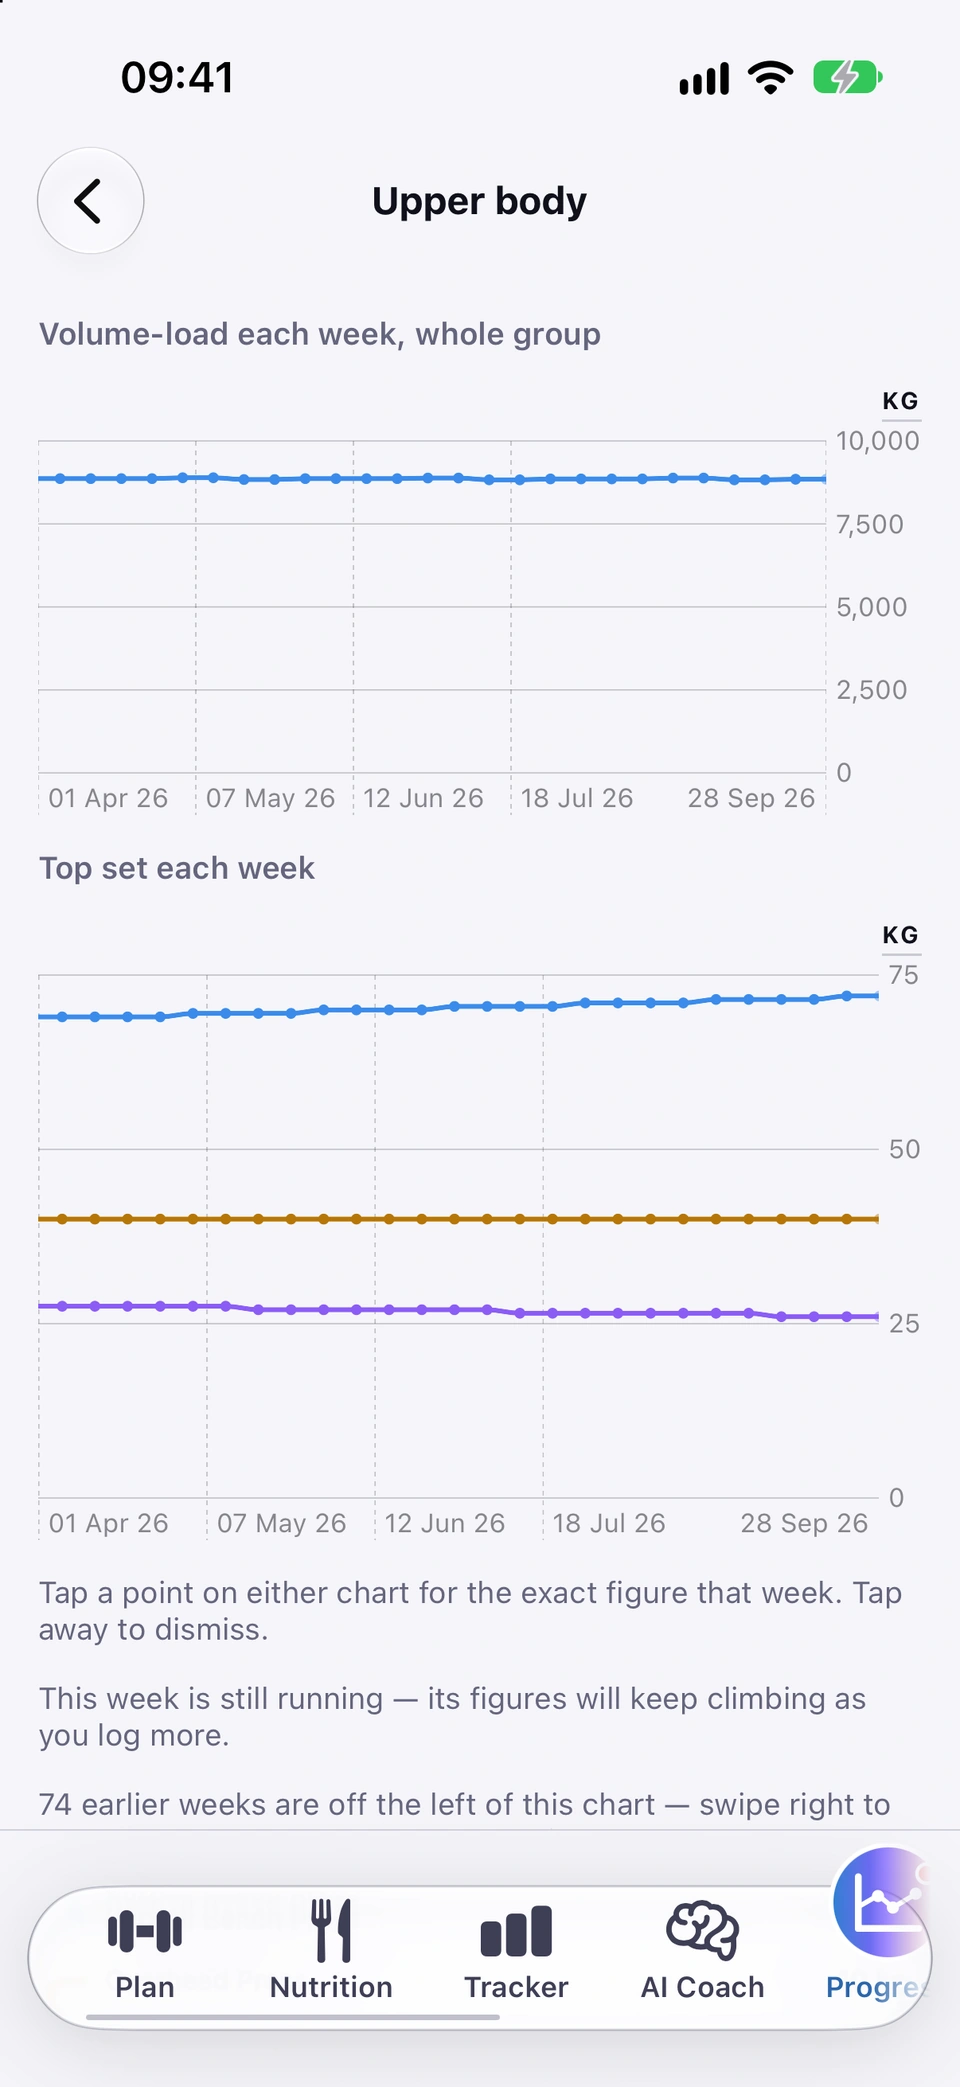
Upper body, Lower body, Back and Core each get their own call and, with the subscription, a chart per movement.
WhereProgress›In the gym›Strength history›group tile
What it is
Opening Strength history shows four tiles — Upper body, Lower body, Back, Core — each called Improving, Holding or Declining. Tap a group to see its weekly volume and a chart per movement.
Why it helps
Strength history's overall word is one number for everything you lift; these four break it down by body area so you can see which part of your training is actually moving.
How your actual rest between sets compares with what your plan prescribed.
WhereProgress›In the gym›Rest discipline
What it is
The Rest discipline tile is a fill bar of your average rest against your plan's target, with a verdict — On plan, Resting long, Resting short or Long and recovered.
Why it helps
Resting too short can undercut recovery between sets; resting too long stretches a session out for no benefit — this tile tells you which, if either, is happening.
Your actual rest, against what your plan asked for.
How to use it
Open the Progress tab and find Rest discipline under In the gym.
Read the fill bar and verdict, then tap it for the full chart with Last 7 days / Last 30 days.
If you train with an Apple Watch streaming live heart rate, how far your heart rate actually drops between sets lives one tap deeper on the same chart, rather than as a tile of its own.
Good to know
Reads No rest data yet until you've logged rested sets.
Calories eaten against calories burned, framed for your own goal — a deficit, surplus or balance, depending what you're going for.
WhereProgress›Fuel & body›Energy balance
What it is
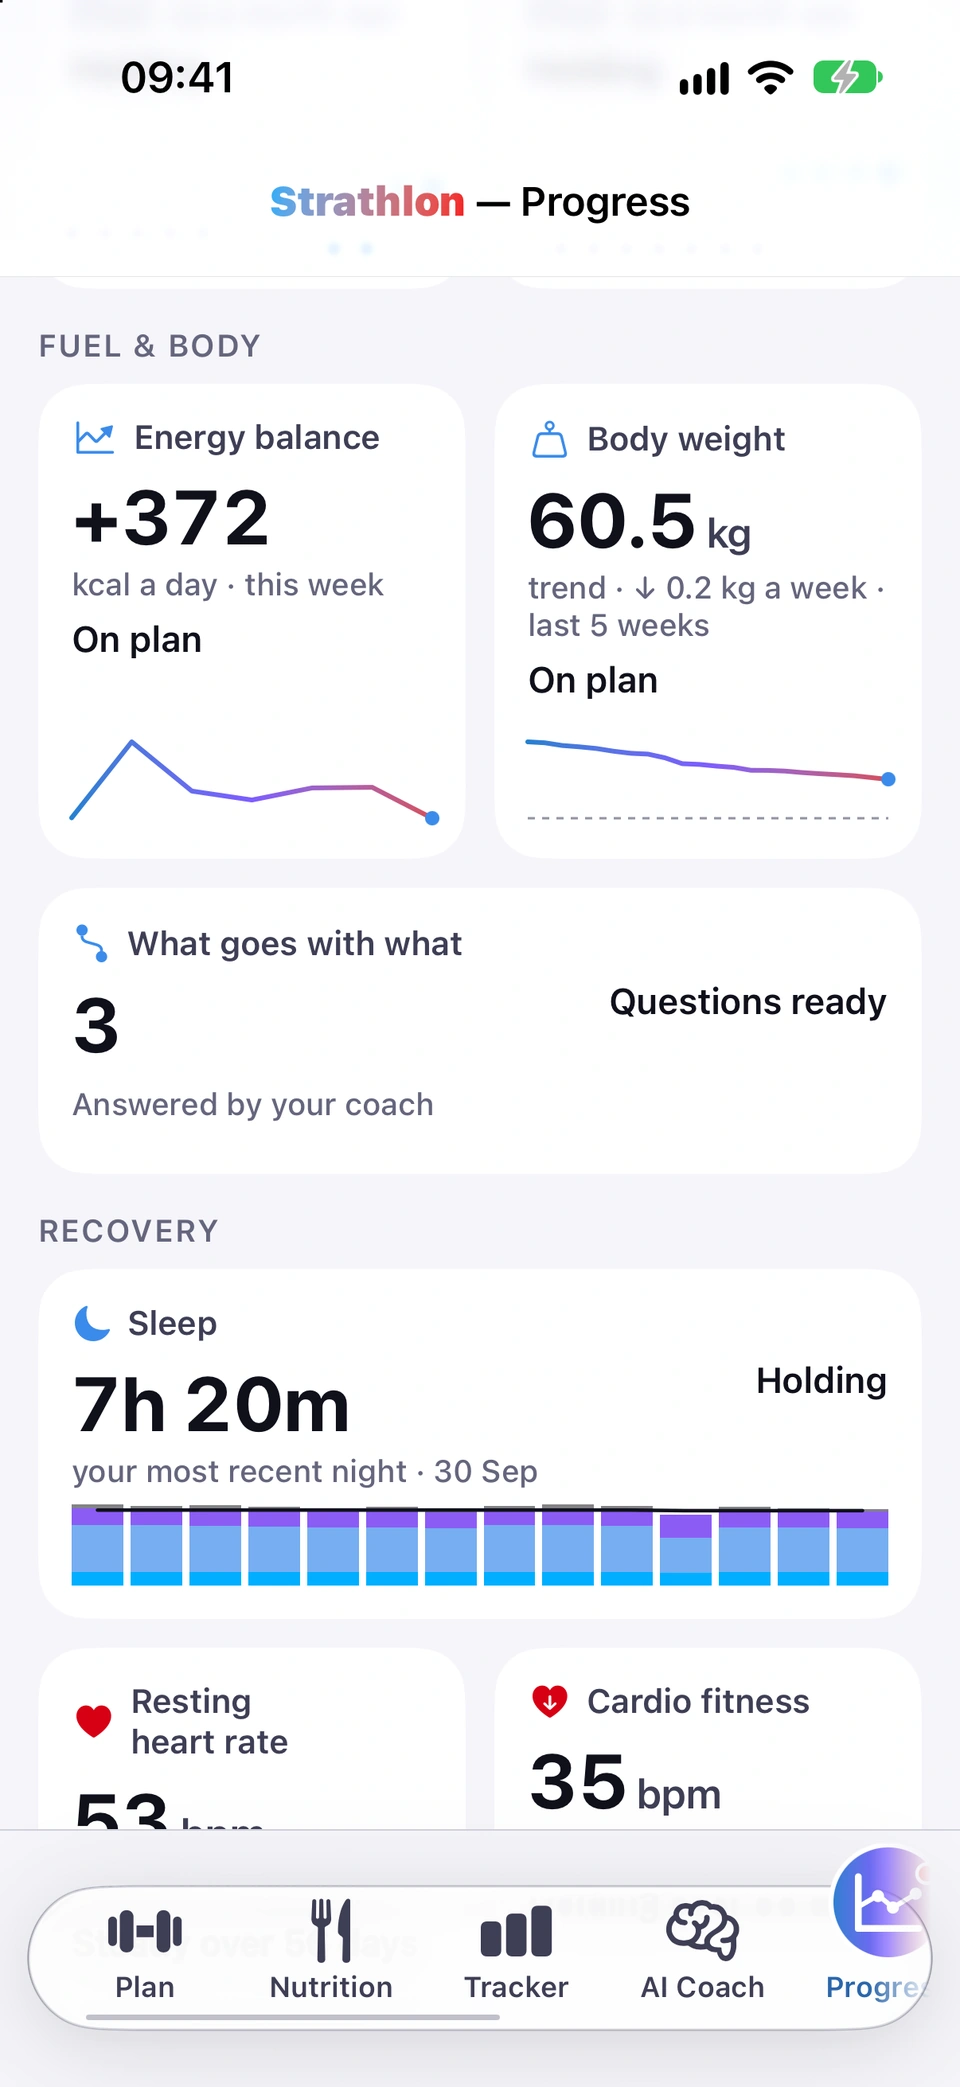
The Energy balance tile shows kcal a day for the latest logged week, framed as a deficit, surplus or balance according to your goal, with a short trend line.
Why it helps
It's the same underlying figure the Tracker's Today card shows, but over time, so you can see whether your eating has actually been tracking your goal or drifting.
Eaten against burned, framed for your goal.
How to use it
Open the Progress tab and find Energy balance under Fuel & body.
Read the figure and the trend line, then tap it for the full chart.
Without an Apple Watch, the figure uses the same estimated burn the Tracker shows, marked est.\.
On a day you logged food in another app that saves to Apple Health, those food calories count toward the balance and the tile adds Includes food logged in other apps. A day with a Strathlon food log uses that log.
Good to know
Reads No meals logged until you've logged food, or, if you have logged food but nothing to net it against, says so and points at Apple Health.
Your actual weight against a predicted line from your logged calories, scrollable and full-screen with pinch-zoom.
WhereProgress›Fuel & body›Body weight
What it is
The Body weight card plots your actual weight as a solid line and, where there's enough data, a dashed predicted line from your tracked calorie deficit or surplus. Tap ⤢ for a full-screen view with pinch-zoom and a drag crosshair.
Why it helps
Real weight and predicted weight often diverge — water and glycogen early on, adaptation later — and seeing both together shows whether a gap is expected or worth a closer look.
How to use it
Open the Progress tab and find Body weight under Fuel & body.
Scroll the chart sideways for history, or tap ⤢ for the full-screen view.
Read the legend for what each line and shaded band means.
Tips
If a scale that syncs to Apple Health supplies your weight, readings are adopted automatically — no confirmation step. A weight you type yourself stands until Apple Health has a newer reading.
Good to know
The chart's trend line and milestones use a smoothed average, so a single unusual reading can't trigger or block a milestone on its own.
The first time you tap this button without health sharing on, you're offered the switch once; decline and you still get an answer, built from what you've logged.
Good to know
Only shows once you have enough weigh-ins and days logged for the gap to mean something.
Tap a red missed-session dot on the weight chart to log that day as trained.
WhereProgress›Body weight›chart›red dot
What it is
A red dot on the Body weight chart marks a day your plan expected a session and none was logged. Tap it for Mark this day as trained?\ and confirm I trained on day\.
Why it helps
Lets you fix a day you actually trained but forgot to log, right from the chart you're already looking at, without navigating elsewhere.
How to use it
On the Body weight chart, tap a red missed-session dot.
Confirm I trained on day\ on the Mark this day as trained?\ prompt.
The dot clears once marked.
Good to know
This logs a session for your phase progression only — it does not count toward your streaks, charts or what the coach is told, and it says so before you confirm.
Pick two things you track and see whether they move together, with the coach on hand to explain it.
WhereProgress›Fuel & body›What goes with what
What it is
The What goes with what card has a menu of pairs to choose from, for example sleep and rest adherence. Pick one and it shows a headline about whether they move together, with Ask the coach about this for the full read.
Why it helps
It's a quick way to check whether two things you track are actually related, without you having to eyeball two separate charts yourself.
How to use it
Open the Progress tab and find What goes with what under Fuel & body.
Tap the ⓘ beside the title for what the card is for and why the answer is a conversation rather than a chart — a scatter plot with a correlation number is an easy way to believe one thing caused another, and this deliberately avoids that.
Good to know
The answer doesn't claim one thing caused the other, and names what else could explain the pattern.
Most tile detail screens let you switch the period shown, either Last 7 days / Last 30 days, or a longer 3M / 6M / 1Y / All range.
WhereProgress›tile detail›Window / Range
What it is
A tile's full-screen chart carries a control at the top: Last 7 days / Last 30 days on weekly-history charts (sessions, volume, rest, energy), or 3M / 6M / 1Y / All on longer-history charts.
Why it helps
Lets you zoom out for the bigger picture, or in for what just happened, from the same chart.
Tile window and range.
How to use it
Open any tile's full-screen chart.
Tap the segmented control at the top to switch window or range.
Good to know
Sleep, resting heart rate and cardio fitness charts have a fixed window instead and show no range control — they always chart the same span, so the window, the axis and the coach are never in disagreement about what's on screen.